TDG GOLD CORP. SAMPLES UP TO 32.9 G/T AND 27.6 G/T GOLD AT METS, TOODOGGONE, B.C.
White Rock, British Columbia, January 20, 2022. TDG Gold Corp. (TSXV: TDG) (the “Company” or “TDG”) is pleased to announce the results of the 2021 exploration program at its former producing high-grade gold Mets Mining Lease located in the road accessible Toodoggone Production Corridor of north-central, B.C. Highlights include grab samples yielding 32.90 grams per tonne (“g/t”) gold (“Au”) and 27.61 g/t Au collected from locations of known historical drill collars (Table 1).
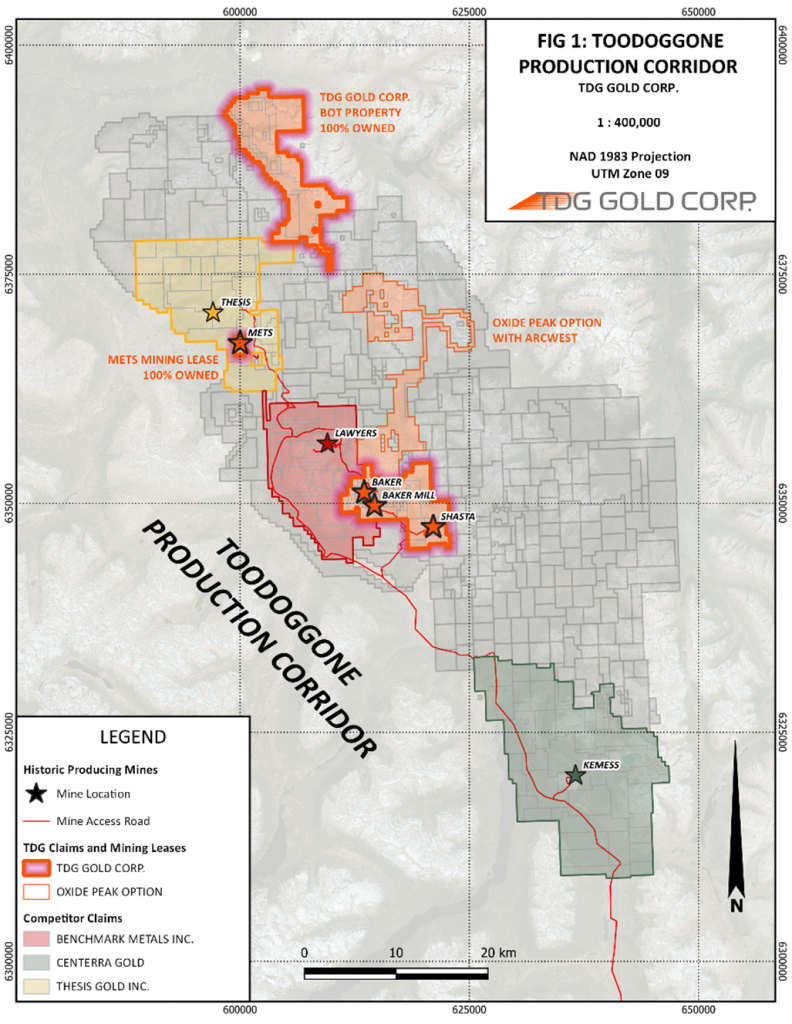
TDG’s Mets Mining Lease consists of 200 hectares located 23 kilometres (“km”) by road from TDG’s Baker Mine (Figure 1). A summary of historical exploration work completed at Mets was published by TDG in its news release dated May 19, 2021 (here). TDG has recompiled 7,944 metres (“m”) of diamond drilling of the 8,784 m reported to have been drilled historically, along with review of the 2,622 m of historical trenching. Historical drill highlights include DDH MT86-08 which intersected 25.9 m of 9.52 g/t Au and MT86-05 intersecting 46.4 m of 3.57 g/t Au (including 11.8 m of 13.93 g/t Au).

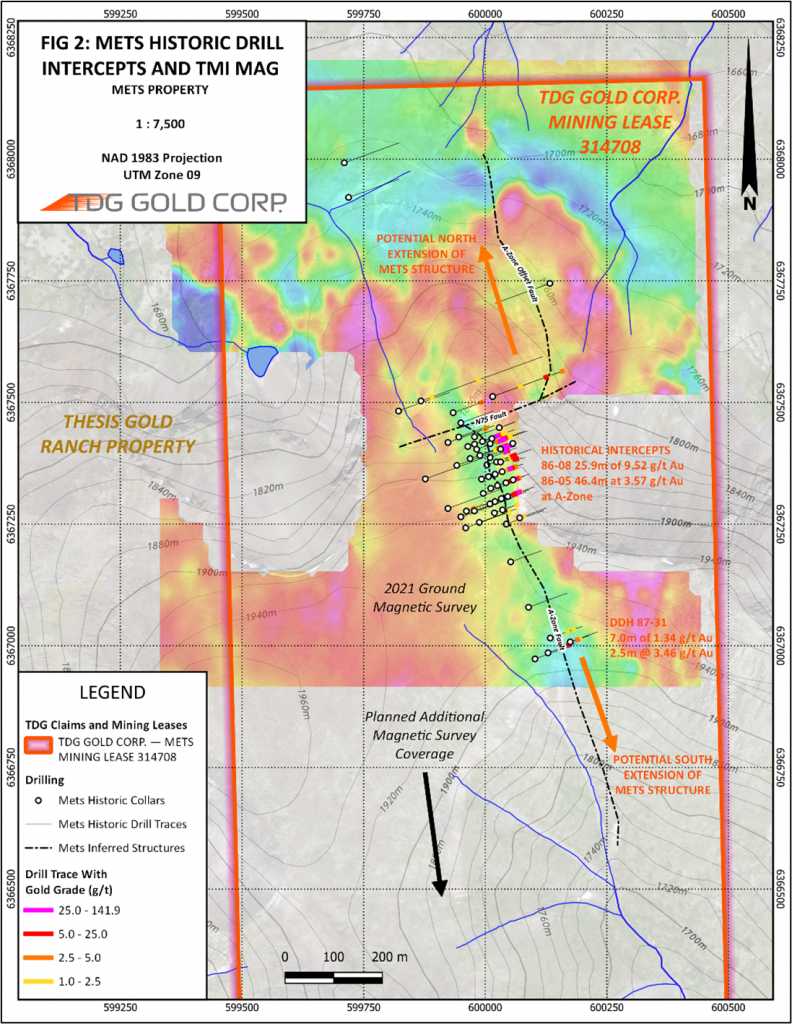
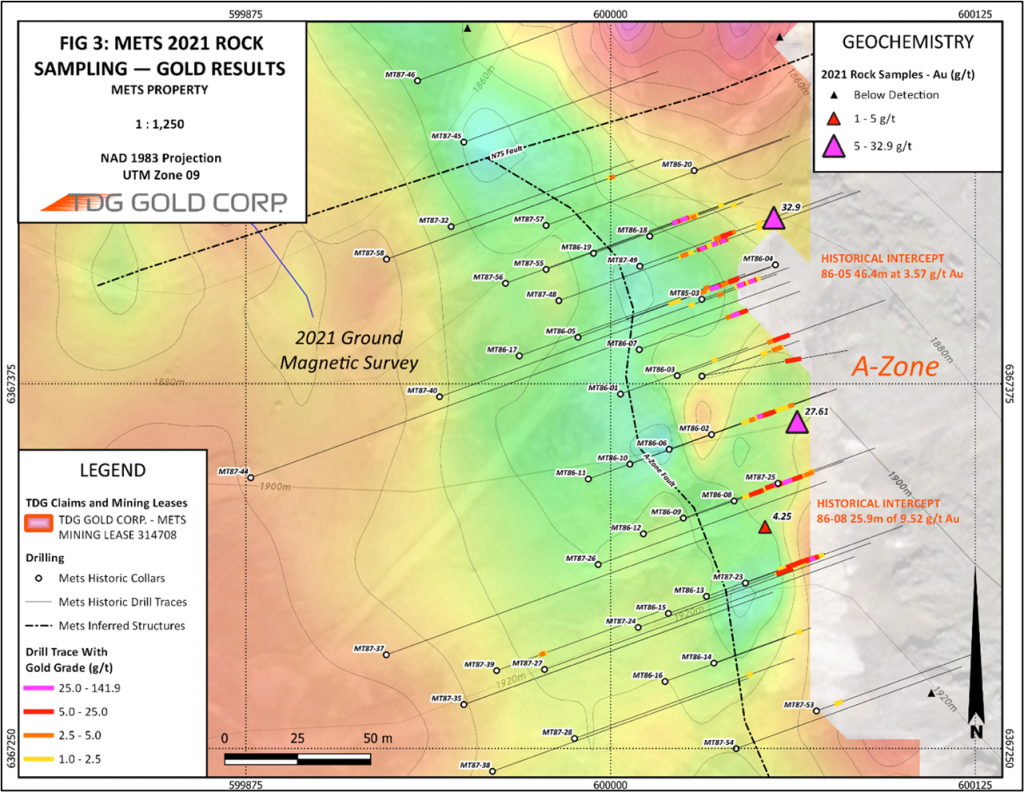
In 2021, TDG completed a ground-based magnetometer survey consisting of 25 line-km that has highlighted several trends (Figure 2), in addition to geological grab sampling over historical collar locations (Figure 3).
Ground Magnetometer Survey Results
Using GEMS Overhauser 19W magnetometer units, a total of 25 line-km of ground-based magnetometer surveys were completed in 2021 on Mets. Magnetic data imagery highlighted several trends, interpreted by Company geologists to coincide with the historically trenched and drilled tested mineralization trend, defined by quartz ± quartz-barite veining, is part of a gold-silver bearing low sulphidation epithermal vein.
Historical trenching and drilling coincide with the A-Zone / Mets Structure. The structure is characterized as a magnetic low lineament in the 2021 magnetic survey. Figure 2 displays the respective historical drill intercepts with respect to the 2021 Total Magnetic Intensity (“MAG TMI”).

Grab Sampling Results
Select grab sampling was completed by Company geologists while completing general reconnaissance of the historically producing Mets property. Samples were selected based on the proximity to historical trenches and drillhole collars, targeting the quartz ± quartz-barite veins. Highlights include grab samples yielding 32.90 grams per tonne (“g/t”) gold (“Au”) and 27.61 g/t Au.
| Sample ID | Easting | Northing | Au (g/t) | Ag (g/t) |
| C00125601 | 600172 | 6367207 | <0.005 | 0.20 |
| C00125602 | 600110 | 6367269 | <0.005 | 1.85 |
| C00125603 | 600056 | 6367432 | 32.90 | 1.74 |
| C00125604 | 599951 | 6367497 | 0.050 | 0.48 |
| C00125605 | 599965 | 6367521 | 0.040 | 0.23 |
| C00125606 | 599976 | 6367540 | <0.005 | 0.15 |
| C00125607 | 600033 | 6367549 | <0.005 | 0.14 |
| C00125608 | 600051 | 6367518 | <0.005 | 0.13 |
| C00125609 | 600058 | 6367494 | <0.005 | 0.62 |
| C00125610 | 600107 | 6367556 | <0.005 | 0.59 |
| C00125262 | 600053 | 6367326 | 4.25 | 0.42 |
| C00125263 | 600064 | 6367362 | 27.61 | 7.25 |

Methodology
Select Grab Sampling: Data for geological field samples include: mineralogy, texture, alteration, and/or structure, and is located using a Garmin GPS64. Field notes are recorded in a field book and/or tablet computer. A rock hammer is used to separate the sample from its exposure and placed into a polyurethane bag with unique sample tag is place in the respective bag and secured using a zip-tie, and subsequently placed in security-sealed rice bags. The respective samples are then shipped as a batch to a third-party lab.
Magnetometer: The survey was conducted using GSM-19W Overhauser “Walking” magnetometers and a stationary GSM-19T Proton “Base Station” unit. “Walking” magnetometers recorded in situ magnetic field intensity while the “Base Station” recorded diurnal variations in the regional magnetic field during the survey. Positioning data was provided by handheld Garmin GPS64 units which were carried by each instrument operator in the field.
Following the completion of the survey, a set of corrections and Quality Assurance / Quality Control (“QA/QC”) procedures were applied to the magnetic data, including diurnal correction, low-pass noise reduction, and individual operator leveling. After this QA/QC process was completed, the data was interpolated using industry-standard Golden Surfer 12 software. After interpolation, high-resolution Total Magnetic Intensity (“TMI”) imagery was exported as a georeferenced TIFF image with matching contour shapefile.
QA/QC
Samples were submitted to SGS Canada’s (“SGS”) laboratory facility in Burnaby, B.C., following a chain of shipping custody from TDG to SGS, for preparation and analysis. The SGS facility is accredited to the ISO/IEC 17025 standard for gold assays, and all analytical methods include internal quality control materials at set frequencies with established data acceptance criteria. As a result of SGS’ rigorous internal QA/QC protocols, TDG did not submit external (blind) QA/QC materials, using a ‘fit for purpose’ approach with the analytical data. Samples were analyzed following the procedures summarized in Table 2, where more information about methodology can be found on the SGS website, in the analytical guide (here).
| SGS | Sample | Collected | Prep | Prep | Prep | Method | Method |
| Certificate | ID | Weight (kg) | Dry | Crush | Pulverize | Au | Ag |
| BBM21-11672 | C00125601 | 1.95 | DRY105_WT | CRU12-15,22 | PUL85 | GOFAI50V10 | GE_IMS40Q12 |
| BBM21-11672 | C00125602 | 1.35 | DRY105_WT | CRU12-15,22 | PUL85 | GOFAI50V10 | GE_IMS40Q12 |
| BBM21-11672 | C00125603 | 1.85 | DRY105_WT | CRU12-15,22 | PUL85 | GOFAI50V10 | GE_IMS40Q12 |
| BBM21-11672 | C00125604 | 2.35 | DRY105_WT | CRU12-15,22 | PUL85 | GOFAI50V10 | GE_IMS40Q12 |
| BBM21-11672 | C00125605 | 1.52 | DRY105_WT | CRU12-15,22 | PUL85 | GOFAI50V10 | GE_IMS40Q12 |
| BBM21-11672 | C00125606 | 1.61 | DRY105_WT | CRU12-15,22 | PUL85 | GOFAI50V10 | GE_IMS40Q12 |
| BBM21-11672 | C00125607 | 1.48 | DRY105_WT | CRU12-15,22 | PUL85 | GOFAI50V10 | GE_IMS40Q12 |
| BBM21-11672 | C00125608 | 2.10 | DRY105_WT | CRU12-15,22 | PUL85 | GOFAI50V10 | GE_IMS40Q12 |
| BBM21-11672 | C00125609 | 2.38 | DRY105_WT | CRU12-15,22 | PUL85 | GOFAI50V10 | GE_IMS40Q12 |
| BBM21-11672 | C00125610 | 2.55 | DRY105_WT | CRU12-15,22 | PUL85 | GOFAI50V10 | GE_IMS40Q12 |
| BBM21-11672 | C00125262 | 2.00 | DRY105_WT | CRU12-15,22 | PUL85 | GOFAI50V10 | GE_IMS40Q12 |
| BBM21-11672 | C00125263 | 1.00 | DRY105_WT | CRU12-15,22 | PUL85 | GOFAI50V10 | GE_IMS40Q12 |
Qualified Person
The technical content of this news release has been reviewed and approved by Steven Kramar, MSc., P.Geo., a qualified person as defined by National Instrument 43-101.
This news release includes historical drilling information that has been reviewed by the Company’s geological team. The Company’s review of the historical records and information reasonably substantiate the validity of the information presented in this news release; however, the Company cannot directly verify the accuracy of the historical data, including the procedures used for sample collection and analysis. Therefore, the Company encourages investors to exercise appropriate caution when evaluating these results.
About TDG Gold Corp.
TDG is a major mineral claim holder in the historical Toodoggone Production Corridor of north-central British Columbia, Canada, with over 23,000 hectares of brownfield and greenfield exploration opportunities under direct ownership or earn-in agreement. TDG’s flagship projects are the former producing, high-grade gold-silver Shasta, Baker and Mets mines, which are all road accessible, produced intermittently between 1981-2012, and have over 65,000 m of historical drilling. In 2021, TDG advanced the projects through compilation of historical data, new geological mapping, geochemical and geophysical surveys, and, for Shasta, drill testing of the known mineralization occurrences and their extensions. TDG currently has 78,361,085 common shares issued and outstanding.
ON BEHALF OF THE BOARD
Fletcher Morgan
Chief Executive Officer
For further information contact:
TDG Gold Corp.,
Telephone: +1.604.536.2711
Email: info@tdggold.com
Neither TSX Venture Exchange nor its Regulation Services Provider (as that term is defined in the policies of the TSX Venture Exchange) accepts responsibility for the adequacy or accuracy of this release.
This news release contains forward-looking statements that are based on the Company’s current expectations and estimates. Forward-looking statements are frequently characterized by words such as “plan”, “expect”, “project”, “intend”, “believe”, “anticipate”, “estimate”, “suggest”, “indicate” and other similar words or statements that certain events or conditions “may” or “will” occur. Such forward-looking statements involve known and unknown risks, uncertainties and other factors that could cause actual events or results to differ materially from estimated or anticipated events or results implied or expressed in such forward-looking statements. Such factors include, among others: the actual results of current exploration activities; conclusions of economic evaluations; changes in project parameters as plans to continue to be refined; possible variations in ore grade or recovery rates; accidents, labour disputes and other risks of the mining industry; delays in obtaining governmental approvals or financing; and fluctuations in metal prices. There may be other factors that cause actions, events or results not to be as anticipated, estimated or intended. Any forward-looking statement speaks only as of the date on which it is made and, except as may be required by applicable securities laws, the Company disclaims any intent or obligation to update any forward-looking statement, whether as a result of new information, future events or results or otherwise. Forward-looking statements are not guarantees of future performance and accordingly undue reliance should not be put on such statements due to the inherent uncertainty therein.