TDG GOLD CORP. REPORTS MORE BROAD, NEAR SURFACE PORPHYRY-STYLE COPPER-GOLD AT BAKER
White Rock, British Columbia, September 06, 2023 – TDG Gold Corp. (TSXV: TDG) (the “Company” or “TDG”) is pleased to announce assay results from resampling of four additional historical drillholes which further support the concept that the Baker Complex1 area of its Toodoggone properties may represent a bulk-tonnage, porphyry-style copper-gold target1. The porphyry-style mineralization was later overprinted by a high-grade epithermal gold-silver (“Au-Ag”) system. Historical drilling at the Baker B-Vein targeted high-grade Au-Ag mineralization and, as a result, drillholes were historically only selectively sampled based on the epithermal Au-Ag model, neglecting broader mineralized zones, and were not assayed for base metals5.
TDG’s relogging and resampling program at the Baker B-Vein (i) confirmed the historical high-grade Au-Ag epithermal-style mineralization, (ii) extended this style of mineralization to depth and, in addition, (iii) identified porphyry-style copper-gold (“Cu-Au”) veining, alteration and sulphide mineralization. The porphyry-style mineralization is comprised of pyrite, chalcopyrite, molybdenite and minor bornite extending up to 126.8 metres (”m”) of core length, starting from near surface and ending in mineralization in all four recently resampled historical drillholes (Table 1).
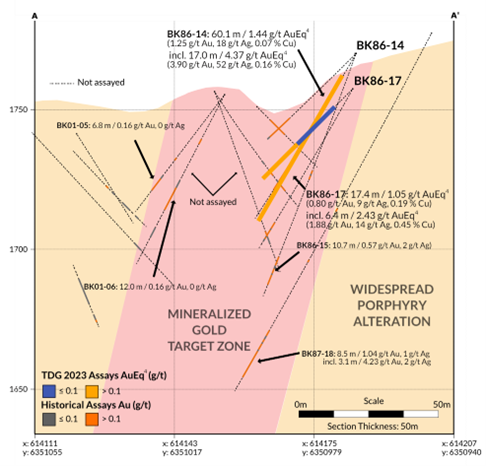
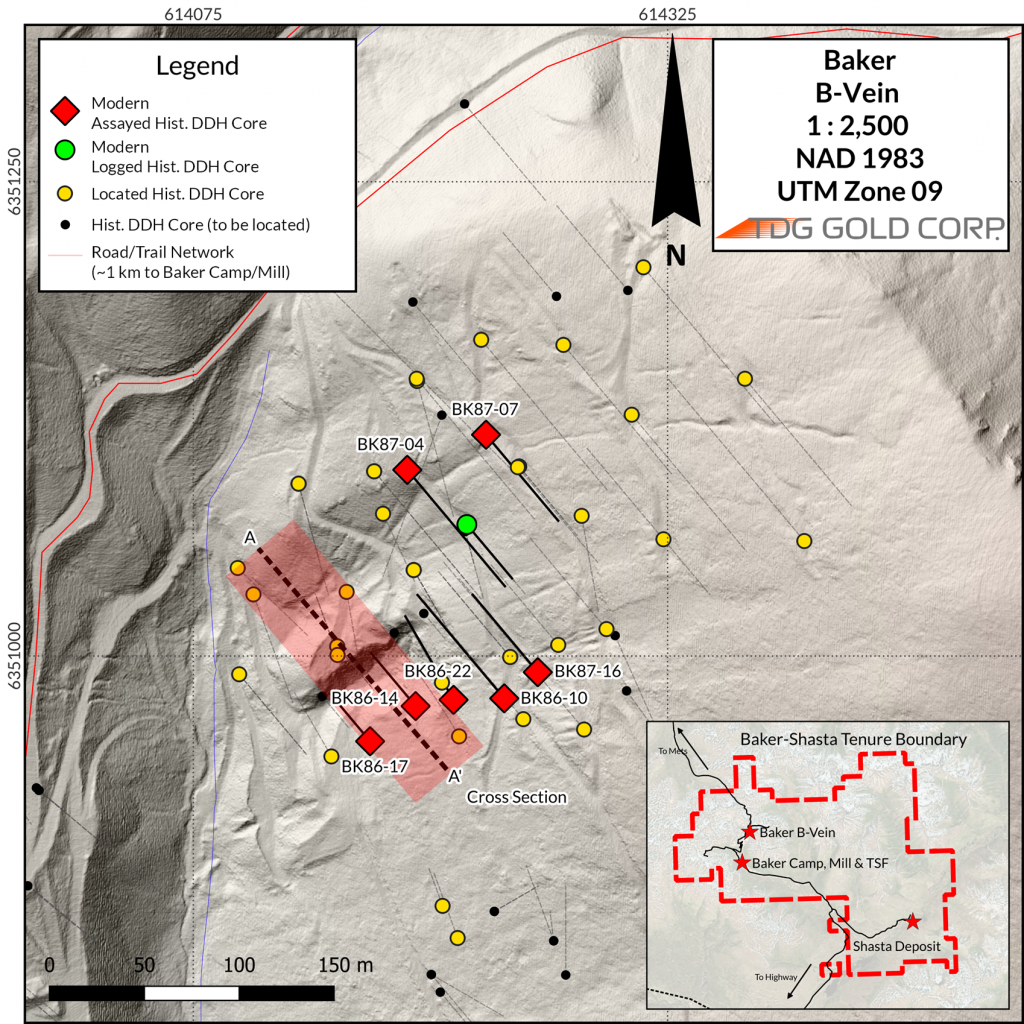
A cross section for the Baker B-Vein exploration area1 (Figure 1) and a plan map (Figure 2), demonstrate the continuity of Au-Ag mineralization and the continuity of the widespread porphyry-style alteration, and suggests both styles of mineralization remain open along strike and at depth.
Table 1. Resample assay results from four historical Baker B-Vein drillholes.
| Drillhole | From | To | Length | Au | Ag | Cu | Cu | AuEq4 | CuEq4 |
| (m) | (m) | (m) | (g/t) | (g/t) | (ppm) | (wt. %) | (g/t) | (wt. %) | |
| BK87-07 | 46.0 | 172.8 | 126.8 | 0.12 | 2 | 357 | 0.04 | 0.17 | 0.14 |
| incl. | 166.4 | 172.8 | 6.4 | 0.56 | 3 | 339 | 0.03 | 0.59 | 0.48 |
| BK86-14 | 9.1 | 69.2 | 60.1 | 1.25 | 18 | 748 | 0.07 | 1.44 | 1.16 |
| incl. | 41.5 | 58.5 | 17.0 | 3.90 | 52 | 1,580 | 0.16 | 4.37 | 3.53 |
| and incl. | 48.7 | 54.0 | 5.3 | 11.66 | 159 | 4,102 | 0.41 | 13.05 | 10.54 |
| BK86-22 | 12.2 | 118.0 | 105.8 | 0.14 | 4 | 460 | 0.05 | 0.22 | 0.18 |
| incl. | 89.0 | 95.5 | 6.5 | 0.34 | 4 | 991 | 0.10 | 0.47 | 0.38 |
| and incl. | 111.0 | 118.0 | 7.0 | 0.29 | 1 | 155 | 0.02 | 0.30 | 0.24 |
| BK86-17 | 28.0 | 45.4 | 17.4 | 0.80 | 9 | 1,876 | 0.19 | 1.05 | 0.85 |
| incl. | 35.4 | 41.8 | 6.4 | 1.88 | 14 | 4,529 | 0.45 | 2.43 | 1.96 |
| and incl. | 37.7 | 39.0 | 1.3 | 7.84 | 31 | 19,100 | 1.91 | 9.86 | 7.96 |
**Composite results were built using 0.1 g/t Au and/or 250 ppm Cu cut-off, although there may be intervals within the composite below 0.1 g/t Au and/or 250 ppm Cu.
***Calculated composites are truncated to significant 2 decimal places for Au/Cu (wt. %)/AuEq/CuEq and the nearest integer for Ag/Cu (ppm).
****Calculated composites may not sum due to rounding.
4Gold Equivalent (AuEq) & Copper Equivalent (CuEq): Gold Equivalent and Copper Equivalent are used for illustrative purposes to express the combined value of Au, Ag and Cu as an equivalent of Au or Cu on an in-situ basis. Calculations are uncut, and actual prices and recoveries (following metallurgical test work) may differ from these assumptions which would change the equivalent value. Price assumptions (approximately in line with the LME 3-year trailing average metal prices) of US$ of $1,800/Oz Au, $22.50/Oz Ag and $3.25/lb Cu (lb) are used with assumed metallurgical recoveries of 94.8 %, 77.2 % and 90.0 % recovery for Au, Ag and Cu, respectively. The resulting formulas are: AuEq(g/t) = ((Au_g/t × Au price per g/t × Au recovery)+(Cu_wt.% × Cu 1% price per tonne × Cu recovery)+(Ag_g/t × Ag price per g/t × Ag recovery)) / (Au price per g/t). CuEq(wt.%) = ((Cu_wt.% × Cu 1% price per tonne × Cu recovery)+(Au_g/t × Au price per g/t × Au recovery)+(Ag_g/t × Ag price per g/t × Ag recovery)) / (Cu price 1 % per tonne).
Steven Kramar, TDG’s VP Exploration, commented: “We’ve now published assay results from seven historical drillholes at the Baker B-Vein located outside the footprint of the small-scale gold-focused extraction that took place in the 1990s. All seven resampled holes have demonstrated near surface porphyry-style mineralization extending over broad intervals, including higher grade epithermal gold-silver-copper veining as an overprint and, most importantly, ending in previously unrecognized copper-gold mineralization. The B-Vein high-grade gold system also remains open along strike and at depth.
Our historical core relogging program has recently been extended to include drillholes across the Baker Complex (which covers ~15 sq.km), with nine historically defined exploration target areas. In parallel, our lithic drainage sediment sampling program is now complete and covers the entire Baker Complex and the adjacent Greater Shasta-Newberry project (the latter includes our mineral resource stage Shasta project). This appears to be the most comprehensive sampling program ever completed at the Baker Complex with a copper-gold focus. We look forward to publishing more results in the coming weeks from these programs.”
TDG’s 2023 Exploration Program at Baker
As reported in our July 25, 2023 & August 15, 2023 news releases, TDG is approaching the Baker Complex1 as a “back to basics” project with potential to host a bulk tonnage porphyry-style copper-gold deposit that is most likely located below historically drilled holes2. TDG has a relogging, resampling and assaying program underway that aims to use the new information to help identify vectors to potential porphyry targets for drill testing in 2024.
TDG has also completed an extensive and intensive lithic drainage sediment sampling (“LDS”) program across the Baker Complex1 and Greater Shasta-Newberry1 footprint focused on the potential for a porphyry target. Results are anticipated by mid-October 2023.
TDG’s historical core relogging, resampling and assaying program is low cost and aims to recover and resample as much as possible of the ~30,000 m of diamond drilling known to have been completed in approximately 350 drillholes across the 15 square kilometre (“sq.km”) Baker Complex1. The Baker historical core inventory is located at the Baker camp and mill site. So far, TDG has identified approximately 100 complete/nearly complete drillholes for relogging, of which approximately 60 are restacked and ready for relogging, 10 have been fully relogged, and 10 have been submitted for assaying and results have been received from 7 (reported herein, July 25, 2023 and August 15, 2023).
During the historical drilling that took place between 1974-2006, only ~15 % of the drillcore length is estimated to have been assayed3 for gold-silver5 and virtually none for any other elements, including copper5. TDG has noted the presence of porphyry-style veining and alteration and the occurrence of bornite (Cu5FeS4), chalcopyrite (CuFeS2) and molybdenite (MoS2) throughout the drillholes relogged.
By systematically relogging the historical core, including drillholes where mining is known to have taken place, followed by resampling5 where appropriate, TDG is aiming to assemble the first comprehensive copper-focused drill database for the Baker Complex1 and to select drill-ready targets for 2024.
Alteration/Mineralization
The geology of Baker B-Vein area can be summarized as a succession of dacite, andesite and associated volcanic tuffs and epiclastic rocks with pervasive widespread quartz-sericite-pyrite (“QSP”) alteration. This package of rocks is cross-cut by multiple intrusive phases and multi-generational stockwork-style quartz, quartz-potassium feldspar and epidote veins hosting pyrite, magnetite, chalcopyrite and occasionally sphalerite, galena and bornite within veins or on vein selvages. All four drillholes reported in this news release ended in Cu-Au mineralization, with anomalous base metals.
The B-vein has a strike length of at least 300 m (the extent of the current drilling), has a vertical extent of over 100 m and lies within a mineralized zone that is approximately 60 m wide. The current extent of drilling, and current re-interpretation of the B-Vein suggest that the high-grade Au-Ag mineralization is open along strike to the west-southwest (trending towards the A-Vein) and to the east-northeast, and at depth, in addition to the widespread Cu-Au porphyry potential surrounding the historical high-grade mineralized target zone.
All B-Vein relogged and modern assayed drillholes continue to support the concept that the Baker B-Vein is a high-grade Au-Ag mineralized core surrounded by a lower grade halo of Cu-Au mineralization and the Cu mineralization in the epithermal veining is likely a function of metal scavenging by hydrothermal fluids from a larger porphyry system at depth.
Results Comparison: 2023 assays from resampling versus historical recorded assays
Historically recorded results for the diamond drillholes (BK87-07, BK86-14, BK86-22 & BK86-17) are presented in Table 2.
Table 2. Historically Recorded Results for Baker B-Vein Drillholes BK87-07, BK86-14, BK86-22 & BK86-17.
| Drillhole | From | To | Interval | Au | Ag |
| (m) | (m) | (m) | (g/t) | (g/t) | |
| BK87-07 | No Comparable Result | ||||
| BK86-14 | 48.7 | 54.0 | 5.3 | 11.53 | 195 |
| BK86-22 | 93.0 | 116.4 | 23.5 | 0.17 | 0 |
| BK86-17 | 35.9 | 41.8 | 6.0 | 1.34 | 11 |
| incl. | 37.7 | 39.0 | 1.3 | 5.39 | 17 |
**Composite results were built using the same assay intervals as Table 1, or the closest equivalent interval with the historical data available.
***Calculated composites are truncated to significant 2 decimal places for Au and the nearest integer for Ag.
****Calculated composites may not sum due to rounding errors.
*****Historically selected sample intervals may differ from assayed intervals of resampled core for logistical and scientific reasons.
Historical Au composite interval data2,3 were compared with modern composite results to investigate data repeatability and reliability. Using the same composite intervals (where available) the first seven B-Vein drillhole composite intervals reported an correlation coefficient(R) of 0.79, illustrating satisfactory correlation of Au and providing reasonable confidence in historical results. Specifically, BK86-14 reported a 25 % reduction in Au grade (comparing one composite interval), BK86-17 reported a > 40 % increase in Au grades (comparing two composite intervals), BK86-22 reported a 355 % increase in Au grades (comparing one composite interval) and BK87-07 had no near comparable composite result. These differences could be due to a combination of factors including: (i) nugget effect, (ii) sample selection methodology and/or, (iii) laboratory methodology particularly for assay results generated by the historical Baker mill laboratory2,3.
QA/QC
Samples for the Baker 2023 core relogging program were handled via rigorous chain of custody, between collection, processing, and delivery to the ALS laboratory in Kamloops or North Vancouver, B.C. The historical drillcores were stored by previous operators in a core storage yard near the Baker Mill. TDG staff recovered and inventoried the historical core and compared and validated the recovered core against historical core logs, box labels and core blocks. The core was subsequently relogged, photographed and sampled at TDG’s Baker Mine site and processed by geologists and technicians. Quality assurance and control (“QAQC”) materials were inserted into the sampling sequence during geological sample selection. The drillcore was selected for sampling and placed in zip-tied polyurethane bags, then in security-sealed rice bags before being delivered directly from the Baker Mine site to Bandstra Transportation Systems in Prince George, B.C., and transported to ALS’ preparation facility in Kamloops, B.C., and ultimately to the ALS laboratory in North Vancouver, B.C (or remained for analysis in Kamloops, B.C.). Samples were prepared and analyzed following procedures Au-GRA21 for Au and ME-MS61 for trace elements. Overlimit concentrations of precious or base metals were analyzed (where applicable) by Au-GRA22, Ag-GRA22, and Cu-OG21 for Au, Ag and Cu respectively. Information about methodology can be found on the ALS Global website, in the analytical guide (here).
QAQC is maintained internally at the lab through rigorous use of internal certified reference materials (“CRMs”), blanks, and duplicates. An additional QAQC program was administered by TDG through the verification of lab results via use of CRMs and blank (unmineralized) samples that were blindly inserted into the sample batch. If a QAQC sample returns an unacceptable value an investigation into the results is triggered and when deemed necessary, the samples that were tested in the batch with the failed QAQC sample are re-tested.
Drillholes in Table 3 utilized NQ size for drillcore. During the resampling process, the entire remaining drillcore was consumed (either the second half of the remaining material, or the entire remaining unsampled material) due to the small diameter of the core. The historical collar location was verified by handheld GPS and will be sited utilizing a more precise Real Time Kinematics (“RTK”) measurement in due course. Table 3 presents the drillhole particulars for drillholes in this news release.
Table 3. Drillhole Particulars
| HOLE ID | UTME NAD83) (mE) | UTMN NAD83 (mN) | Azimuth (°) | Dip (°) | Final Depth (m) |
| BK87-07 | 614,229 | 6,351,117 | 140 | -70 | 172.8 |
| BK86-14 | 614,192 | 6,350,974 | 320 | -60 | 69.2 |
| BK86-22 | 614,212 | 6,350,977 | 330 | -65 | 118.0 |
| BK86-17 | 614,168 | 6,350,955 | 320 | -45 | 45.4 |
Qualified Person
The geologically related technical content of this new release has been reviewed and approved by Steven Kramar, P.Geo., Vice President, Exploration for TDG and a Qualified Person, as defined under National Instrument 43-101.
1Mineral Exploration/Exploration Target Area(s): TDG is a mineral exploration focused company and the Company’s Projects are in the mineral exploration stage only. The degree of risk increases substantially where an issuer’s properties are in the mineral exploration stage as opposed to the development or operational stage. Exploration targets and/or Exploration zones and/or Exploration areas are speculative and there is no certainty that any future work or evaluation will lead to the definition of a mineral resource.
2Historical Data: This news release includes historical information that has been reviewed by TDG’s qualified person (QP). TDG’s review of the historical records and information reasonably substantiate the validity of the information presented in this news release; however, TDG cannot directly verify the accuracy of the historical data, including (but not limited to) the procedures used for sample collection and analysis. Therefore, any conclusions or interpretations borne from use of this data should be considered too speculative to suggest that additional exploration will result in mineral resource delineation. TDG encourages readers to exercise appropriate caution when evaluating these data and/or results.
3Historical Drillcore Sampling & Assay Methodology: Historical drillcore was geologically logged with lithologies identified and notable geological features recorded. Historical drillcore was split in half (and in rare cases sawn in half) along sample intervals (lithology and mineralization dependant) generally less than 3 m. Chemical analysis was performed dominantly for precious metal analysis (Au and Ag), and infrequently for base metals (Pb, Zn, Cu), and rarely for major elements and trace elements. Historically, different commercial laboratories were utilized in addition to an assay lab at Baker Mine Site. These lab facilities may or may not have had accreditation and in all cases accreditation (if applicable) pre-dated current ISO standards. Over that period, a variety of digestion and assay methods were used, including atomic absorption, fire assay atomic absorption, aqua regia atomic absorption and aqua regia ICP with varying detection limits. Reference materials (if any) were inserted at the analytical level and thus were unblind to the facility processing the samples.
4Gold Equivalent (AuEq) & Copper Equivalent (CuEq): Gold Equivalent and Copper Equivalent are used for illustrative purposes to express the combined value of Au, Ag and Cu as an equivalent of Au or Cu on an in-situ basis. Calculations are uncut, and actual prices and recoveries (following metallurgical test work) may differ from these assumptions which would change the equivalent value. Price assumptions (approximately in line with the LME 3-year trailing average metal prices) of US$ of $1,800/Oz Au, $22.50/Oz Ag and $3.25/lb Cu (lb) are used with assumed metallurgical recoveries of 94.8 %, 77.2 % and 90.0 % recovery for Au, Ag and Cu, respectively. The resulting formulas are: AuEq(g/t) = ((Au_g/t × Au price per g/t × Au recovery)+(Cu_wt.% × Cu 1% price per tonne × Cu recovery)+(Ag_g/t × Ag price per g/t × Ag recovery)) / (Au price per g/t). CuEq(wt.%) = ((Cu_wt.% × Cu 1% price per tonne × Cu recovery)+(Au_g/t × Au price per g/t × Au recovery)+(Ag_g/t × Ag price per g/t × Ag recovery)) / (Cu price 1 % per tonne).
5Unassayed Historical Drillcore: Historical drillcore intersections, lengths or intervals referenced for assay or geological analysis may not be available or suitable for sampling. Historical drillcores were inherited with the project and TDG provides no guarantees or warranties that these drillcores are part of the historical inventory, are available and/or have not degraded to a state that would render them wholly unusable for the purposes of scientific investigation. TDG provides no warranties/guarantees that these historical unassayed drillcores host precious or base metal mineralization.
About TDG Gold Corp.
TDG is a major mineral tenure holder in the historical Toodoggone Production Corridor of north-central British Columbia, Canada, with over 23,000 hectares of brownfield and greenfield exploration opportunities under direct ownership or earn-in agreement. TDG’s flagship projects are the former producing, high-grade gold-silver Shasta and Baker mines, which produced intermittently between 1981-2012, and the high-grade gold-silver Mets development project, all which are all road accessible, and have over 65,000 m of historical2,3 drilling. The projects have been advanced through compilation of historical2 data, new geological mapping, geochemical and geophysical surveys and, at Shasta, 13,250 m of modern HQ drill testing of the known mineralization occurrences and their potential extensions. In May 2023, TDG published an updated Mineral Resource Estimate for Shasta (see TDG news release May 01, 2023) which remains open at depth and along strike. In January 2023, TDG defined a larger exploration target area adjacent to Shasta (Greater Shasta-Newberry; see TDG news release January 25, 2023).
ON BEHALF OF THE BOARD
Fletcher Morgan
Chief Executive Officer
For further information contact:
TDG Gold Corp.,
Telephone: +1.604.536.2711
Email: info@tdggold.com
Neither TSX Venture Exchange nor its Regulation Services Provider (as that term is defined in the policies of the TSX Venture Exchange) accepts responsibility for the adequacy or accuracy of this release.
Forward Looking Statements
This news release contains forward-looking statements that are based on the Company’s current expectations and estimates. Forward-looking statements are frequently characterized by words such as “concept”,”represent”, ”interpret”, “potential”, “aim”, “likely”, “support”, “demonstrate”, “suggest”, “identify”, “vector”, and variations of these words as well as other similar words or statements that certain events or conditions “could”, “may”, “would” or “will” occur. Such forward-looking statements involve known and unknown risks, uncertainties and other factors that could cause actual events or results to differ materially from estimated or anticipated events or results implied or expressed in such forward-looking statements. Such factors include, among others: the actual results of current and planned exploration activities; the potential for a discovery of a porphyry Cu +/- Au or other style of mineral deposit with economic grade; results from future exploration programs; that geological and/or geophysical anomalies remain open (in any direction); conclusions of future economic evaluations; changes in project parameters as plans to continue to be refined; possible variations in grades of mineralization and/or future actual recovery rates; accidents, labour disputes and other risks of the mining industry; the availability of sufficient funding on terms acceptable to the company to complete the planned work programs; delays in obtaining governmental approvals or financing; and fluctuations in metal prices. There may be other factors that cause actions, events or results not to be as anticipated, estimated or intended. Any forward-looking statement speaks only as of the date on which it is made and, except as may be required by applicable securities laws, the Company disclaims any intent or obligation to update any forward-looking statement, whether as a result of new information, future events or results or otherwise. Forward-looking statements are not guarantees of future performance and accordingly undue reliance should not be put on such statements due to the inherent uncertainty therein.