TDG GOLD ASSAYS 43 METRES OF 2.11 G/T AUEQ FROM 20 METRES DEPTH AT SHASTA, TOODOGGONE
White Rock, British Columbia, February 12, 2024. TDG Gold Corp (TSXV: TDG) (the “Company” or “TDG”) is pleased to report the first batch of assay results from the historical core relogging and resampling program undertaken at its Shasta gold-silver deposit, located in the Toodoggone, north-central B.C.
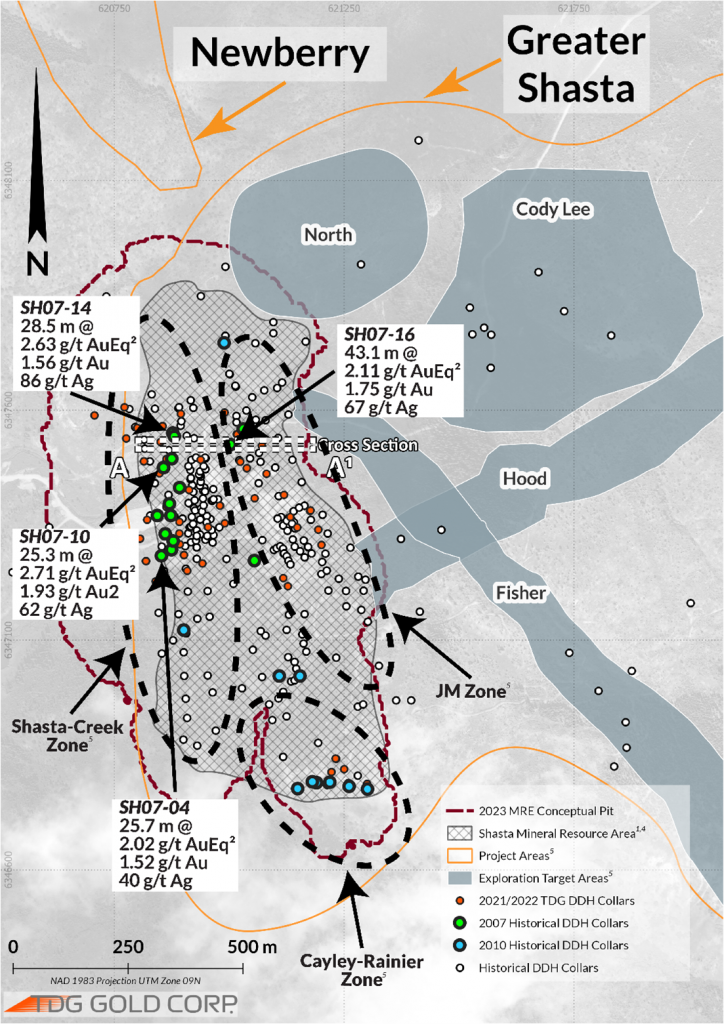
TDG relogged, resampled and assayed 26 diamond drillholes, totalling ~2,900m of core, dating from 2007 and 2010, all drilled within the footprint of the existing Shasta Mineral Resource Estimate (“MRE1”) (Figure 2). No historical assay results for the 2007 series drillholes were available and no collar locations for the 2010 series drillholes were previously verified. Neither series (except for two of the 2010 drillholes) were utilized in the current Shasta MRE1 published by TDG (news release May 01, 2023). The collar locations have now been verified and the new assay data supports inclusion of these higher grade, near surface intercepts in a future MRE1.
Highlights include (see Appendix for complete results):
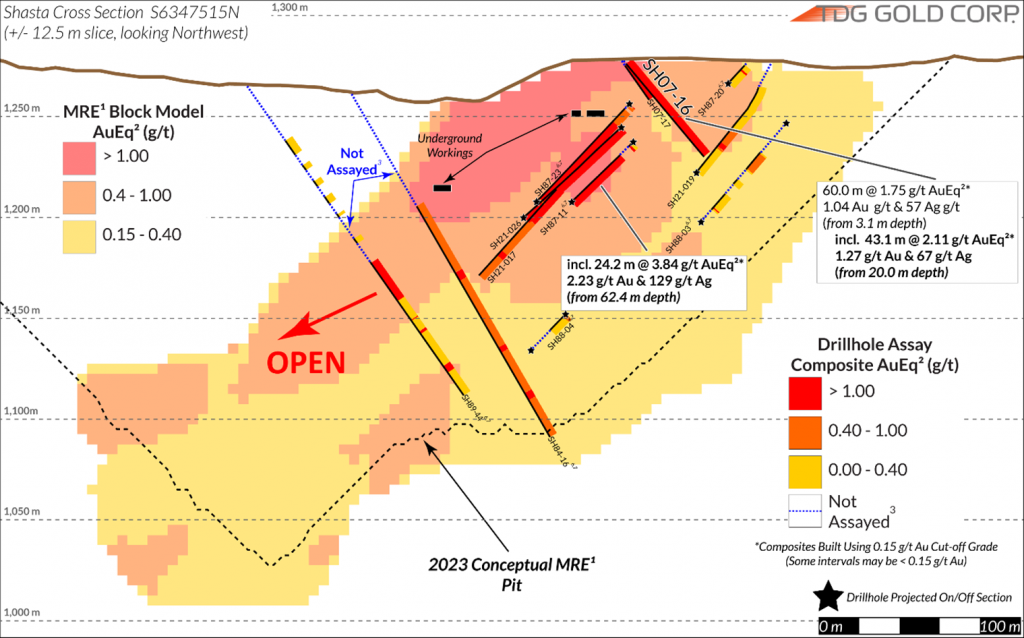
SH07-16: (JM East; Figure 1 and Figure 2): 60.0 m grading 1.04 grams per tonne (“g/t”) gold (“Au”) and 57 g/t silver (“Ag”) [1.75 g/t gold equivalent (“AuEq”2)] from 3.0 m depth and ending in mineralization,
Including 43.1 m grading 1.27 g/t Au and 67 g/t Ag [2.11 g/t AuEq2] from 20.0 m depth
SH07-04: (Shasta; Figure 2): 65.0 m grading 0.64 g/t Au and 18 g/t Ag [0.87 g/t AuEq2] from 78.0 m depth
Including 25.7 m grading 1.52 g/t Au and 40 g/t Ag [2.02 g/t AuEq2] from 78.0 m depth
SH07-10: (Creek; Figure 2): 53.0 m grading 1.08 g/t Au and 33 g/t Ag [1.49 g/t AuEq2] from 66.0 m depth
Including 25.3 m grading 1.93 g/t Au and 62 g/t Ag [2.71 g/t AuEq2] from 72.0 m depth
SH07-14: (Creek; Figure 2): 63.7 m grading 0.87 g/t Au and 42 g/t Ag [1.40 g/t AuEq2] from 43.8 m depth
Including 28.5 m grading 1.56 g/t Au and 86 g/t Ag [2.63 g/t AuEq2] from 45.5 m depth
Steven Kramar, TDG’s VP Exploration, commented: “Historical sampling of core was focused on narrow zones of higher-grade mineralization. TDG’s systematic recovery of this legacy core, followed by relogging, resampling and assaying of the entire mineralized envelope, has yielded meaningful rewards, demonstrating consistent wide zones of gold-silver mineralization that encompass notable intercepts with significantly higher grades. With these data, including more detailed logging and geochemistry, we can better define controls on mineralization and use that knowledge to extrapolate potential extensions to the current MRE1. We will be reviewing these new assay results to determine how they might influence the current Shasta MRE1.”
2007 Series Drilling
The 2007 diamond drilling was mostly located along the western side of the Shasta deposit, in the Shasta zone (Figure 2, green circles). Historically, core was cut and sent for analysis, but the legacy data (assays and drill logs) were never located by TDG. TDG has now successfully located and validated the 2007 series drill collars and subsequently relogged, resampled and sent all recoverable drillcore for analysis of the precious metal content and a full suite of multi-element geochemistry. These drillholes add additional multi-element data TDG’s existing database, and the precious metal assay results may positively impact the current Shasta MRE1 by improving confidence between existing drillholes and adding higher grades in areas with sparse drilling (Figure 1).
2010 Series Drilling
The 2010 series of diamond drilling was focused within the Cayley-Rainer zone (Figure 2, blue circles). This zone has demonstrated potential to host bonanza grades, with SH21-022 intersecting 1.5 m grading 50.2 g/t Au and 4,871 g/t Ag [111 g/t AuEq1] from 113.5 m depth (see news release Feb 07, 2022). Previously, the 2010 series drilling also suffered from poor collar validation and only two drillholes were sufficiently accurately recorded to support inclusion within the 2023 MRE1 calculation. As with the 2007 drillholes, the remaining 2010 drill collars have since been validated, and therefore this data may now be used in a potential MRE1 update. Additionally, these new assays and geochemical data could provide clues on vectoring between the Cayley-Rainer zone and the JM zone (~400 m distance). This is an area where drill and historical assay density is currently the lowest at Shasta and the new information could potentially expand the bonanza grade mineralization intercepted in 2021.
1980s Series Drilling
In 2023, TDG also undertook a broader relogging, resampling and assaying program to target (a) the satellite deposits within the Greater Shasta target area and (b) potential extensions to the mineralization at the Shasta deposit. The drillcore from the Cody Lee target area5 and the Fisher target area5 were recovered and cores from 7 and 6 holes, respectively, were relogged, resampled and assayed in entirety; results are pending. Around the main Shasta deposit, drillcore with the potential to assist in upgrading the MRE1 and provide valuable multi-element data were also relogged and resampled from the JM east, Shasta north and Shasta Creek areas, all within the MRE1 area. These samples are being processed through the assay lab and results will be published in due course.
QA/QC
Samples for the Shasta 2023 relogging, resampling and assay program were handled via rigorous chain of custody, through sample collection, processing, and delivery to the ALS Global laboratory in either North Vancouver or Kamloops, B.C. The drillcore was logged, photographed, and sampled at TDG’s Baker Mine site and processed by geologists and technicians. The drillcore selected for sampling was either: (i) already split from previous sampling (mechanized core splitter or rarely diamond saw) and sample intervals were utilized (where applicable) to follow along historical sampling intervals or (ii) intervals with no previous sampling were split using mechanical splitter. The drillcore selected for sampling was and then placed in zip-tied polyurethane bags, then in security-sealed rice bags before being delivered directly by TDG staff from the Baker Mine site, to Bandstra Transportation Systems in Prince George, ultimately to the ALS Global facility in North Vancouver or Kamloops, B.C. Samples were prepared and analyzed following procedures: PREP-31BN for sample preparation, AU-AA25 for Au and ME-MS61 for Ag and trace elements. Overlimit concentrations of precious or base metals were analyzed (where applicable) by AU-GRA22, AG-GRA21 and/or ME-OG62 for Au, Ag and base metals, respectively. Information about methodology can be found on the ALS Global website, in the analytical guide (here).
QAQC is maintained internally at the lab through rigorous use of internal certified reference materials (“CRMs”), blanks, and duplicates. An additional QAQC program was administered by TDG through the verification of lab results via use of CRMs and blank (unmineralized) samples that were blindly inserted into the sample batch. Duplicates (pulp) were selected approximately every 20 samples by internal lab procedures. If a QAQC sample returns an unacceptable value an investigation into the results is triggered and when deemed necessary, the samples that were tested in the batch with the failed QAQC sample are re-tested.
Table 2 presents the particulars for the drillholes in this news release. Collar locations were derived from a previous operators database, converted into UTM UPS NAD83 Zone: 9N coordinate format and validated (where practical and/or possible) using high accuracy Differential Global Positioning System (“DGPS”) system. Collars were also validated against historical maps and files where possible.
Table 2. Drillhole Collar Information.
| Hole ID | UTME NAD83 (mE) | UTMN NAD83 (mN) | Bearing (°) | Inclination (°) | Final Depth (m) |
| SH07-01 | 620,874 | 6,347,297 | 90 | -45 | 102.7 |
| SH07-02 | 620,852 | 6,347,283 | 90 | -45 | 127.1 |
| SH07-03 | 620,878 | 6,347,316 | 90 | -45 | 130.2 |
| SH07-04 | 620,861 | 6,347,331 | 90 | -45 | 145.4 |
| SH07-07 | 620,844 | 6,347,371 | 90 | -45 | 157.6 |
| SH07-09 | 620,857 | 6,347,475 | 105 | -45 | 151.5 |
| SH07-10 | 620,857 | 6,347,475 | 90 | -45 | 127.1 |
| SH07-11 | 620,857 | 6,347,475 | 90 | -60 | 139.3 |
| SH07-12 | 620,875 | 6,347,495 | 90 | -45 | 124.1 |
| SH07-13 | 620,877 | 6,347,551 | 90 | -45 | 108.9 |
| SH07-14 | 620,877 | 6,347,551 | 90 | -60 | 111.9 |
| SH07-15 | 620,881 | 6,347,543 | 90 | -50 | 114.9 |
| SH07-16 | 621,003 | 6,347,525 | 90 | -50 | 63.1 |
| SH07-17 | 621,002 | 6,347,526 | 90 | -55 | 24.4 |
| SH07-18 | 621,031 | 6,347,559 | 82 | -55 | 102.7 |
| SH07-19 | 621,055 | 6,347,273 | 240 | -48 | 111.9 |
| SH10-01 | 621,219 | 6,346,791 | 270 | -47 | 75.0 |
| SH10-02 | 621,261 | 6,346,782 | 270 | -45 | 78.0 |
| SH10-03 | 621,190 | 6,346,790 | 268 | -50 | 50.9 |
| SH10-04 | 621,190 | 6,346,790 | 240 | -50 | 53.6 |
| SH10-05 | 621,190 | 6,346,790 | 240 | -65 | 57.3 |
| SH10-06 | 621,149 | 6,346,777 | 85 | -45 | 78.0 |
| SH10-07 | 621,181 | 6,346,792 | 165 | -45 | 21.3 |
| SH10-08 | 621,301 | 6,346,776 | 275 | -45 | 169.4 |
| SH10-11 | 620,901 | 6,347,122 | 60 | -45 | 151.5 |
| SH10-13 | 620,989 | 6,347,747 | 75 | -50 | 154.6 |
Qualified Person
The technical content of this news release has been reviewed and approved Steven Kramar, MSc., P.Geo., Vice President, Exploration for TDG Gold Corp., a qualified person as defined by National Instrument 43-101.
1Mineral Resource Estimate (MRE): All scientific and technical information relating to the TDG’s Shasta Project pertaining to the Mineral Resource Estimate (“Shasta MRE”) contained in this news release is derived from the Technical Report dated June 14, 2023 (with an effective date of February 11, 2023) titled “The Toodoggone Portfolio and the 2023 Resource Estimate for the Shasta Deposit” (the “2023 Technical Report”) prepared by Sue Bird, MSc., P.Eng. of Moose Mountain Technical Services. The information contained herein in respect of the Shasta MRE is subject to all of the assumptions, qualifications and procedures set out in the 2023 Technical Report and reference should be made to the full text of the 2023 Technical Report, a copy of which has been filed with the securities regulators in each of the provinces of Canada (except Québec) and is available on www.sedarplus.ca.
2Gold Equivalent (AuEq): Gold Equivalent (AuEq) is used for illustrative purposes, to express the combined value of Au and Ag as a percentage of Au on an in-situ basis. Calculations are uncut and recovery is assumed to be 90% for each metal with an Au price of US$1,800/oz and an Ag price of US$22.50/oz (based on trends over the past approximately three years), giving an 80:1 silver to gold ratio for AuEq calculation purposes. Actual prices and recoveries (following metallurgical test work) may differ from these assumptions, which would change the ratio.
3Unassayed Historical Drillcore: Historical drillcore intersections, lengths or intervals referenced for re-assay or geological analysis may not be available or suitable for sampling. Historical drillcores were inherited with the project and these unassayed drillcores may or may not (1) be part of the remaining historical core inventory, (2) be available and/or (3) have not degraded to a state that would render them wholly unusable for the purposes of scientific investigation. These historical un-assayed drillcores may or may not host precious or base metal mineralization.
4Indicated/Inferred Mineral Resources: TDG is a mineral exploration focused company and the Company’s Projects are in the mineral exploration stage only. The degree of risk increases substantially where an issuer’s properties are in the mineral exploration stage as opposed to the development or operational stage. Confidence in an inferred/indicated mineral resource estimate is insufficient to allow meaningful application of the technical and economic parameters to enable an evaluation of economic viability sufficient for public disclosure, except in certain limited circumstances set out in NI 43-101. There is no assurance that mineral resources (of any class) will be converted into mineral reserves. Inferred mineral resources are considered too speculative geologically to have economic considerations applied to them that would enable them to be categorized as mineral reserves. It is reasonably expected that the majority of inferred mineral resources could be upgraded to a indicated mineral resource with continued exploration and proper scientific evaluation.
5Mineral Exploration/Exploration Target Area(s): Exploration targets and/or Exploration zones and/or Exploration areas are speculative and there is no certainty that any future work or evaluation will lead to the definition of a mineral resource.
6Historical Data: This news release includes historical information that has been reviewed by TDG’s qualified person (QP). TDG’s review of the historical records and information reasonably substantiate the validity of the information presented in this news release; however, TDG cannot directly verify the accuracy of the historical data, including (but not limited to) the procedures used for sample collection and analysis. Therefore, any conclusions or interpretations borne from use of this data should be considered too speculative to suggest that additional exploration will result in mineral resource delineation. TDG encourages readers to exercise appropriate caution when evaluating these data and/or results.
7Historical Drillcore Sampling & Assay Methodology: Historical drillcore that has not been relogged, resampled and assayed by TDG was geologically logged with lithologies identified and notable geological features recorded by prior operators. That historical drillcore was split in half (and in rare cases sawn in half) along sample intervals (lithology and mineralization dependant) generally less than 3 m by those operators. Chemical analysis was performed dominantly for precious metal analysis (Au and Ag), and infrequently for base metals (Pb, Zn, Cu), and rarely for major elements and trace elements. Historically, different commercial laboratories were utilized in addition to an assay lab at Baker Mine Site. These lab facilities may or may not have had accreditation and in all cases accreditation (if applicable) pre-dated current ISO standards. Over that period, a variety of digestion and assay methods were used, including atomic absorption, fire assay atomic absorption, aqua regia atomic absorption and aqua regia ICP, with varying detection limits. Reference materials (if any) were inserted at the analytical level and thus were unblind to the facility processing the samples.
About TDG Gold Corp.
TDG is a major mineral tenure holder in the historical Toodoggone Production Corridor of north-central British Columbia, Canada, with over 23,000 hectares of brownfield and greenfield exploration opportunities under direct ownership or earn-in agreement. TDG’s flagship projects are the former producing, high-grade gold-silver Shasta and Baker mines, which produced intermittently between 1981-2012, and the historical high-grade gold Mets developed prospect, all of which are road accessible, and combined have over 65,000 m of historical drilling. The projects have been advanced through compilation of historical data, new geological mapping, geochemical and geophysical surveys and, at Shasta, 13,250 m of modern HQ drill testing of the known mineralization occurrences and their potential extensions. In May 2023, TDG published an updated Mineral Resource Estimate for Shasta (see TDG news release May 01, 2023) which remains open at depth and along strike. In January 2023, TDG defined a larger exploration target area adjacent to Shasta (Greater Shasta-Newberry; see TDG news release January 25, 2023). In 2023, TDG published the first modern drill results from the Mets mining lease (see TDG news releases September 07, 2023, September 11, 2023 and November 28, 2023).
ON BEHALF OF THE BOARD
Fletcher Morgan
Chief Executive Officer
For further information contact:
TDG Gold Corp.,
Telephone: +1.604.536.2711
Email: info@tdggold.com
Neither TSX Venture Exchange nor its Regulation Services Provider (as that term is defined in the policies of the TSX Venture Exchange) accepts responsibility for the adequacy or accuracy of this release.
Forward Looking Statements
This news release contains forward-looking statements that are based on the Company’s current expectations and estimates. Forward-looking statements are frequently characterized by words such as, “demonstrate”, “potential”, “validate”, “expand”, “yield“, support”, “meaningful”, “extrapolate”, “impact”, “expand”, “valuable”, and variations of these words as well as other similar words or statements that certain events or conditions “could”, “may”, “should”, “would” or “will” occur. Such forward-looking statements involve known and unknown risks, uncertainties and other factors that could cause actual events or results to differ materially from estimated or anticipated events or results implied or expressed in such forward-looking statements. Such factors include, among others: the actual results of current and planned exploration activities including the potential for positive changes to the current mineral resource estimate, expansion of higher grade zones and vectors for future exploration targeting; outcomes of future economic evaluations; changes in project parameters as plans to continue to be refined; possible variations in grades of mineralization and/or future actual recovery rates; accidents, labour disputes and other risks common to the mining industry; the availability of sufficient funding on terms acceptable to the Company to complete the planned work programs; delays in obtaining governmental approvals or financing; and fluctuations in metal prices. There may be other factors that cause actions, events or results not to be as anticipated, estimated, or intended. Any forward-looking statement speaks only as of the date on which it is made and, except as may be required by applicable securities laws, the Company disclaims any intent or obligation to update any forward-looking statement, whether as a result of new information, future events, or results or otherwise. Forward-looking statements are not guarantees of future performance and accordingly undue reliance should not be put on such statements due to the inherent uncertainty therein.
APPENDIX:
Table 1. Assay results from 2007 + 2010 Shasta Drillholes.
| Drillhole | From | To | Length | Au | Ag | AuEq2 | Notes |
| (m) | (m) | (m) | (g/t) | (g/t) | (g/t) | ||
| SH07-01 | 58.2 | 102.7 | 44.5 | 0.86 | 41 | 1.37 | |
| incl. | 69.0 | 86.0 | 17.0 | 1.84 | 83 | 2.88 | Ends In Mineralization |
| SH07-02 | 68.0 | 103.7 | 35.7 | 0.69 | 42 | 1.22 | |
| incl. | 78.2 | 99.0 | 20.8 | 0.94 | 61 | 1.71 | Ends In Mineralization |
| SH07-03 | 71.0 | 99.0 | 28.0 | 0.25 | 17 | 0.47 | |
| SH07-04 | 78.0 | 143.0 | 65.0 | 0.64 | 18 | 0.87 | |
| incl. | 78.0 | 103.7 | 25.7 | 1.52 | 40 | 2.02 | |
| SH07-07 | 99.5 | 120.1 | 20.7 | 0.48 | 21 | 0.74 | |
| and | 137.2 | 157.3 | 20.0 | 0.48 | 20 | 0.73 | |
| SH07-09 | 68.4 | 151.5 | 83.1 | 0.69 | 14 | 0.86 | |
| incl. | 76.0 | 88.0 | 12.0 | 1.89 | 34 | 2.31 | Ends In Mineralization |
| SH07-10 | 66.0 | 119.0 | 53.0 | 1.08 | 33 | 1.49 | |
| incl. | 72.0 | 97.3 | 25.3 | 1.93 | 62 | 2.71 | |
| SH07-11 | 70.0 | 138.0 | 68.0 | 0.55 | 11 | 0.68 | |
| incl. | 80.0 | 92.0 | 12.0 | 1.54 | 20 | 1.79 | |
| SH07-12 | 45.4 | 122.5 | 77.1 | 0.61 | 16 | 0.80 | |
| incl. | 45.9 | 47.2 | 1.3 | 11.94 | 61 | 12.70 | |
| SH07-13 | 40.5 | 108.8 | 68.4 | 0.52 | 20 | 0.76 | |
| incl. | 40.5 | 52.2 | 11.7 | 1.56 | 48 | 2.16 | |
| SH07-14 | 43.8 | 107.5 | 63.7 | 0.87 | 42 | 1.40 | |
| incl. | 45.5 | 74.0 | 28.5 | 1.56 | 86 | 2.63 | |
| SH07-15 | 72.9 | 114.9 | 42.1 | 0.26 | 13 | 0.42 | Ends In Mineralization |
| SH07-16 | 3.1 | 63.1 | 60.0 | 1.04 | 57 | 1.75 | |
| incl. | 20.0 | 63.1 | 43.1 | 1.27 | 67 | 2.11 | Ends In Mineralization |
| SH07-17 | 3.8 | 24.4 | 20.6 | 0.65 | 29 | 1.01 | Failed to Reach Target Depth |
| SH07-18 | 6.0 | 99.7 | 93.7 | 0.23 | 9 | 0.35 | |
| incl. | 86.0 | 94.0 | 8.0 | 1.31 | 33 | 1.73 | Ends In Mineralization |
| SH07-19 | No Significant Results | ||||||
| SH10-016,7 | 18.9 | 72.0 | 53.1 | 0.49 | 29 | 0.85 | Includes 10.1 m of unassayed core |
| incl. | 22.3 | 29.7 | 7.4 | 1.59 | 165 | 3.66 | Ends In Mineralization |
| SH10-026,7 | No Significant Results | ||||||
| SH10-036,7 | 22.3 | 39.9 | 17.6 | 0.27 | 16 | 0.47 | |
| SH10-046,7 | 20.7 | 41.0 | 20.2 | 0.60 | 20 | 0.85 | |
| SH10-056,7 | 31.1 | 55.2 | 24.1 | 1.79 | 14 | 1.96 | |
| incl. | 40.0 | 47.6 | 7.6 | 5.07 | 20 | 5.32 | |
| and incl. | 40.0 | 41.0 | 1.0 | 23.23 | 53 | 23.89 | Ends In Mineralization |
| SH10-066,7 | 31.7 | 52.4 | 20.7 | 0.49 | 17 | 0.70 | |
| incl. | 44.5 | 46.9 | 2.4 | 2.99 | 103 | 4.27 | Ends In Mineralization |
| SH10-076,7 | 3.0 | 18.4 | 15.4 | 0.18 | 5 | 0.24 | Ends In Mineralization |
| SH10-086,7 | No Significant Results | ||||||
| SH10-116,7 | 64.7 | 71.0 | 6.3 | 2.16 | 7 | 2.25 | Ends In Mineralization |
| SH10-136,7 | 30.2 | 61.9 | 31.7 | 0.55 | 11 | 0.69 | Includes 5.0 m of unassayed core carried at 0 g/t here |
*Intervals are core-length weighted. True width is estimated between 75-95 % of core length, and the core recovery is estimated to be > 90 %.
**Composite results were built using a 0.15 g/t AuEq cut-off, although there may be intervals within the composite below 0.15 g/t AuEq.
***Calculated composites are truncated to significant 2 digits for Au/AuEq and the nearest whole number for Ag.
**** Calculated composite may not sum due to rounding.