TDG Gold Corp. Historical Drilling Results Demonstrate Bulk Tonnage Potential At The Former Producing Gold-Silver Shasta Mine
[To learn more about the former producing Shasta Mine click here]
White Rock, British Columbia, January 05, 2021. TDG Gold Corp (TSXV: TDG) (the “Company” or “TDG”) is pleased to provide an update on its interpretation work of the historical drilling undertaken on JM and Creek-Shasta Zones of the former producing high-grade gold and silver Shasta Mine located in the Toodoggone Region of northern British Columbia.
Interpretation of historical data demonstrates gold and silver bulk tonnage potential surrounding the former mined areas of the JM and Creek Zone veins (Figure 1) together with their mineralized strike extensions to the south and south-east. Select drill logs and assays show gold and silver mineralization extends into host rock and vein stockworks in widths up to 100 metres. Only 63% of historical drill core was assayed and therefore there remains the potential to increase mineralized widths in several areas through resampling of historical core and drilling of new holes.
Shasta Historical Workings
A preliminary site assessment and reconstruction of historical mine working data was undertaken by Tetra Tech Inc. All mine levels, stopes, pits and access drifts were recreated from historical mine working drawings. Tetra Tech also provided a final estimated volume extraction from the 300-metre length JM Zone and the 300-metre length Creek Zone totaling approximately 420,000 tonnes including ore and waste.
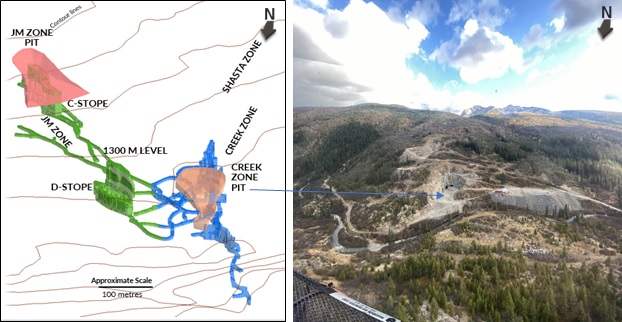
Further to TDG’s news release of December 16, 2020, twelve mineralized zones have been outlined at Shasta using historical and publically available data. The regional Shasta exploration target covers an area approximately 800 metres by 1500 metres. Eleven of the twelve mineralized zones at the Shasta project were previously drilled although some targets are only represented by extremely limited numbers of drillholes. This news release focuses on historical data for the known Creek-Shasta and JM Zones covering a strike length of approximately 750 metres.
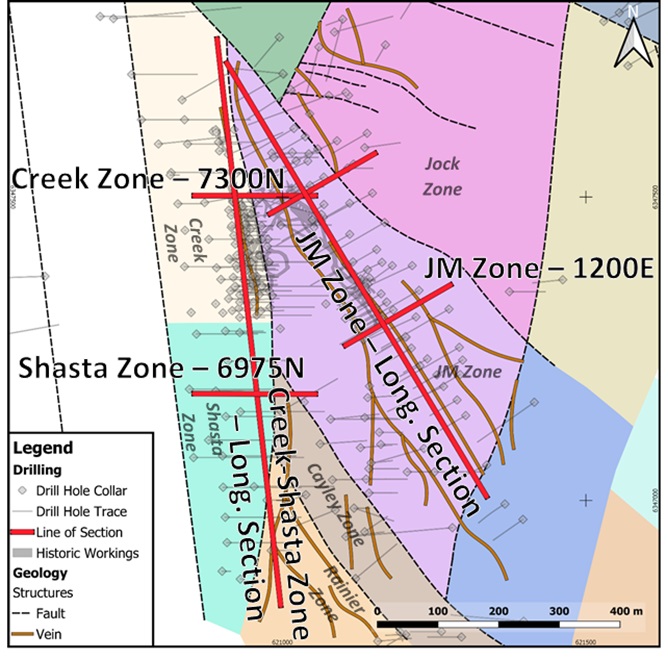
Figure 2 below shows the location of the three zones for which drill hole longitudinal sections and cross sections are included in this news release (Figures 3-7). Additional cross sections will be published in the Shasta project area of the TDG website (https://tdggold.com/projects/shasta/).
Shasta Area Longitudinal Sections for Creek-Shasta and JM Zones
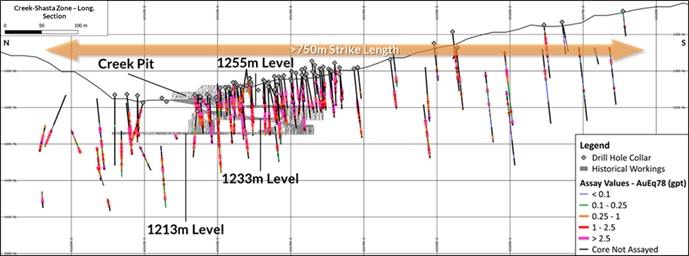
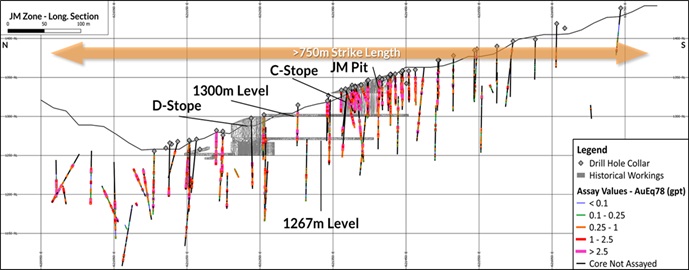
Historical drilling and assay results show gold-silver mineralization is present surrounding the voids of the Creek and JM Zones mine workings and is also open to the north and south. Significant sections of core were not sampled.
Creek-Shasta Zone Longitudinal Section
JM Zone Longitudinal Section
Shasta Area Cross Sections
Creek-Shasta Zone Historical Results for Cross Sections 7300N (Figure 4) & 6975N (Figure 5)
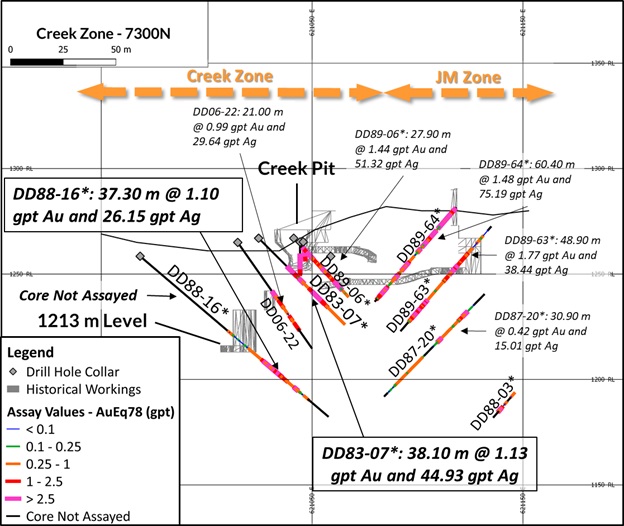
Creek Zone Section 7300N
Table 1 shows historical drill assay results with mineralized widths up to 38.1 metres (“m”) of 1.13 grams per ton (“gpt”) gold and 44.93 gpt silver within the former mine workings area. The records illustrate that sections of core were not assayed, and sampling did not continue into “halo” mineralization.
Table 1
| Hole ID | From (m) | To (m) | Composite Length (m) | Au (gpt) | Ag (gpt) | Zone Section 7300N |
| DD83-07* | 19.20 | 57.30 | 38.10 | 1.13 | 44.93 | Creek Zone, below historical workings |
| including | 19.20 | 31.10 | 11.90 | 1.65 | 28.92 | |
| including | 34.40 | 45.70 | 11.30 | 1.40 | 104.42 | |
| DD88-16* | 68.50 | 105.80 | 37.30 | 1.1 | 26.15 | Creek Zone, below historical workings |
| including | 68.50 | 79.00 | 10.50 | 1.11 | 44.55 | |
| including | 84.30 | 93.30 | 9.00 | 2.16 | 30.94 |
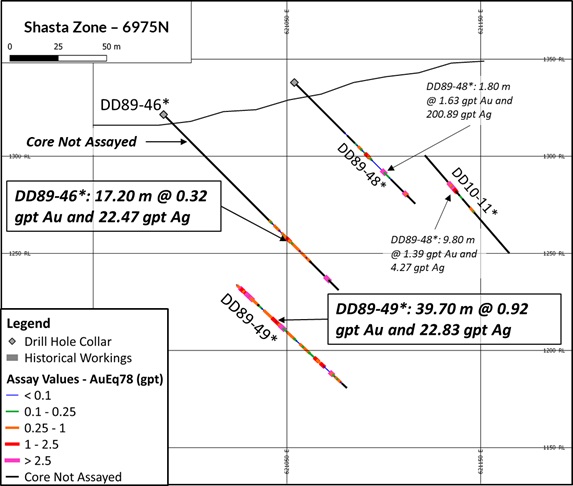
Shasta Zone Section 6975N
Table 2 shows historical drill assay results with mineralized widths up to 39.70 m of 0.92 gpt gold and 22.83 gpt silver including 4.0 m @ 4.78 gpt gold and 27.49 gpt silver 325 m step out along strike to the south. The section illustrates long intervals of core that were not assayed.
Table 2
| Hole ID | From (m) | To (m) | Composite Length (m) | Au (gpt) | Ag (gpt) | Zone Section 6975N |
| DD89-46* | 86.90 | 104.10 | 17.20 | 0.32 | 22.47 | Shasta Zone, step out along strike |
| including | 90.60 | 92.00 | 1.40 | 1.17 | 65.20 | |
| and | 118.50 | 120.60 | 2.10 | 1.91 | 311.93 | |
| DD89-49* | 112.00 | 151.70 | 39.70 | 0.92 | 22.83 | Shasta Zone, step out along strike |
| including | 114.30 | 121.70 | 7.40 | 1.45 | 59.30 | |
| including | 140.20 | 144.20 | 4.00 | 4.78 | 27.49 | |
| and | 159.20 | 172.40 | 13.20 | 0.29 | 18.79 | |
| and | 177.80 | 179.30 | 1.50 | 0.57 | 46.47 |
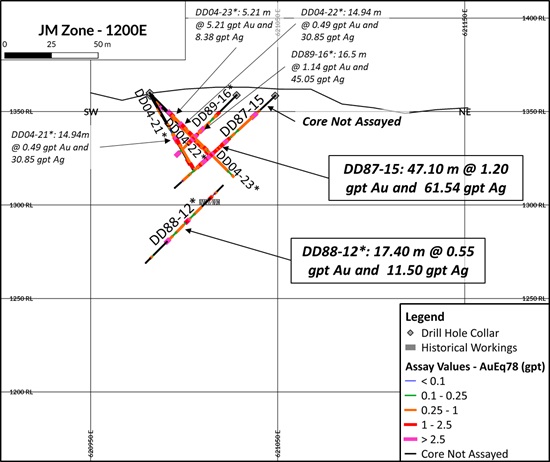
JM Zone Historical Results for Cross Sections 1075E (Figure 6) & 1200E (Figure 7)
Table 3 shows historical drill assay results with mineralized widths up to 48.90 m of 1.77 gpt gold and 38.44 gpt silver within former mine workings and extending below the developed levels.
Table 3
| Hole ID | From (m) | To (m) | Composite Length (m) | Au (gpt) | Ag (gpt) | JM Zone Section 1075E |
| DD87-20* | 20.30 | 51.20 | 30.90 | 0.42 | 15.01 | JM zone, below historical workings area |
| including | 26.10 | 30.30 | 4.20 | 1.57 | 32.07 | |
| 60.80 | 74.20 | 13.40 | 0.43 | 32.60 | ||
| including | 63.50 | 68.00 | 4.50 | 0.68 | 50.00 | |
| DD89-63* | 26.90 | 75.80 | 48.90 | 1.77 | 38.44 | JM zone, below historical workings area |
| including | 34.20 | 43.20 | 9.00 | 1.51 | 97.28 | |
| including | 60.90 | 74.80 | 13.90 | 4.59 | 33.62 |

Table 4 shows historical drill assay results with mineralized widths up to 47.10 m of 1.20 gpt gold and 61.56 gpt silver approximately 25 m to the south of historical workings area.
Table 4
| Hole ID | From (m) | To (m) | Composite Length (m) | Au (gpt) | Ag (gpt) | Zone |
| DD87-15 | 11.90 | 59.00 | 47.10 | 1.20 | 61.56 | JM Zone, step out to south from historical workings |
| including | 13.40 | 18.10 | 4.70 | 1.85 | 72.17 | |
| including | 46.00 | 53.60 | 7.60 | 4.09 | 223.76 | |
| DD88-12* | 25.20 | 29.10 | 3.90 | 0.90 | 50.34 | JM Zone, step out to south from historical workings |
| 48.70 | 50.70 | 2.00 | 1.35 | 43.68 | ||
| 102.90 | 120.30 | 17.40 | 0.55 | 11.50 | ||
| including | 102.90 | 105.50 | 2.60 | 1.19 | 25.92 | |
| including | 118.30 | 120.30 | 2.00 | 1.81 | 16.08 |
TDG geologists continue to compile the historical drill data longitudinal sections and cross sections for the other mineralized zones identified in the Shasta Exploration Area. Results will be published in the coming weeks. During 2021, subject to operational approvals, TDG proposes to drill test the multiple gold and silver veins and the potential bulk tonnage stockwork mineralization. Successful confirmation of historical drill results and mineralized halo widths will rapidly advance the project to resource definition in 2021-2022.
Other News
TDG is pleased to announce Andy Randell, PGeo., has been appointed interim Vice President of Exploration. Former V.P. Exploration Duncan McBean has resigned for personal reasons.
Drill Hole Details
| Hole_ID | Easting (NAD83 ZN9) | Northing (NAD83 ZN9) | Elevation (m) | Azimuth (o) | Dip (o) | EOH (m) |
| DD83-07* | 620928 | 6347497 | 1267 | 90 | -45 | 57.3 |
| DD87-15 | 621182 | 6347314 | 1358 | 240 | -45 | 72.8 |
| DD87-20* | 621068 | 6347533 | 1276 | 242 | -45 | 134.6 |
| DD88-12* | 621220 | 6347302 | 1365 | 245 | -45 | 136.2 |
| DD88-16* | 620872 | 6347491 | 1258 | 80 | -40 | 118 |
| DD89-46* | 620890 | 6347180 | 1322 | 88 | -45 | 127.4 |
| DD89-49* | 620846 | 6347183 | 1310 | 90 | -43 | 188.4 |
| DD89-63* | 621045 | 6347519 | 1281 | 240 | -45 | 81.7 |
* Note 1: drill holes with an asterisk denote that assay results are recorded from written reports and government filed assessment reports. Laboratory certificates in these examples have not been found in historical data search. Some records also show that samples were assayed at the Baker Mine Site Laboratory, where no individual assay certificates are recorded.
Qualified Person
The technical content of this news release has been reviewed and approved Andy Randell, P.Geo., a qualified person as defined by National Instrument 43-101.
About TDG Gold Corp.
TDG is a major mineral claimholder in the Toodoggone District of northern British Columbia, Canada, with over 23,000 hectares of brownfield and greenfield exploration opportunities under direct ownership or earn-in agreement. TDG’s key projects are the former producing, high-grade gold and silver Shasta and Baker Mines which are both road accessible, produced intermittently between 1979-2012, and have over 50,000 metres of historical drilling. In 2021, TDG proposes to advance the projects through compilation of historical data, new geological mapping, geochemical and geophysical surveys, and drill testing of the known mineralization occurrences and their extensions. TDG currently has 57,268,669 common shares issued and outstanding; at December 31st 2020, TDG had approximately $4.85million cash in treasury.
ON BEHALF OF THE BOARD
Fletcher Morgan, Chief Executive Officer
For further information:
TDG Gold Corp.,
Telephone: +1.604.536.2711
Email: info@tdggold.com
Neither TSX Venture Exchange nor its Regulation Services Provider (as that term is defined in the policies of the TSX Venture Exchange) accepts responsibility for the adequacy or accuracy of this release.
This news release may contain certain “forward looking statements”. Forward-looking statements involve known and unknown risks, uncertainties, assumptions and other factors that may cause the actual results, performance or achievements of the Company to be materially different from any future results, performance or achievements expressed or implied by the forward-looking statements. Any forward-looking statement speaks only as of the date of this news release and, except as may be required by applicable securities laws, the Company disclaims any intent or obligation to update any forward-looking statement, whether as a result of new information, future events or results or otherwise.